-
摘要:目的
岩体节理粗糙度对其剪切、渗流等力学性质有重要影响,其精准定量化表征对节理岩体工程实践具有重要意义。目前研究成果表明统计参数中一阶导数均方根与岩体节理粗糙度最具相关性,是表征节理粗糙度的重要方法之一,然而采样间隔严重影响其表征结果。
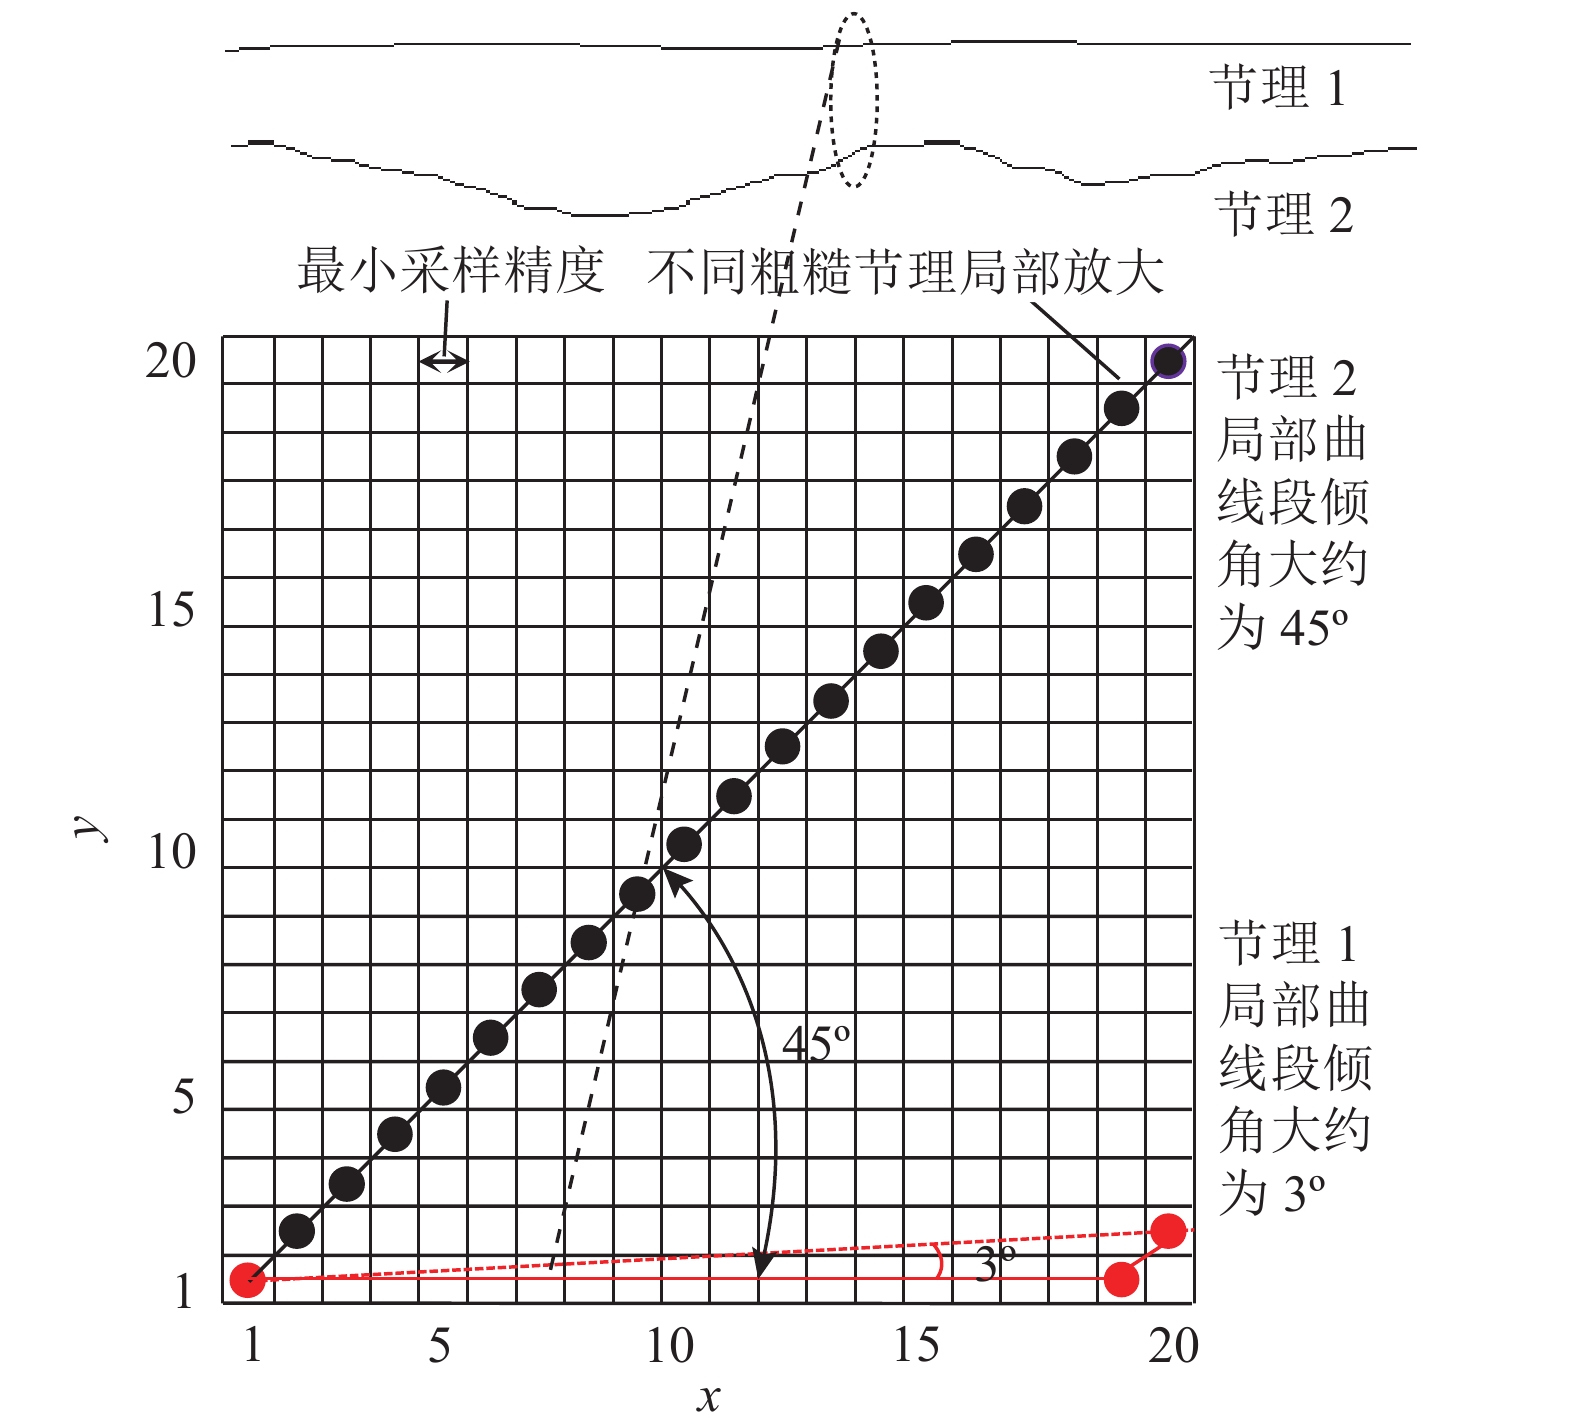
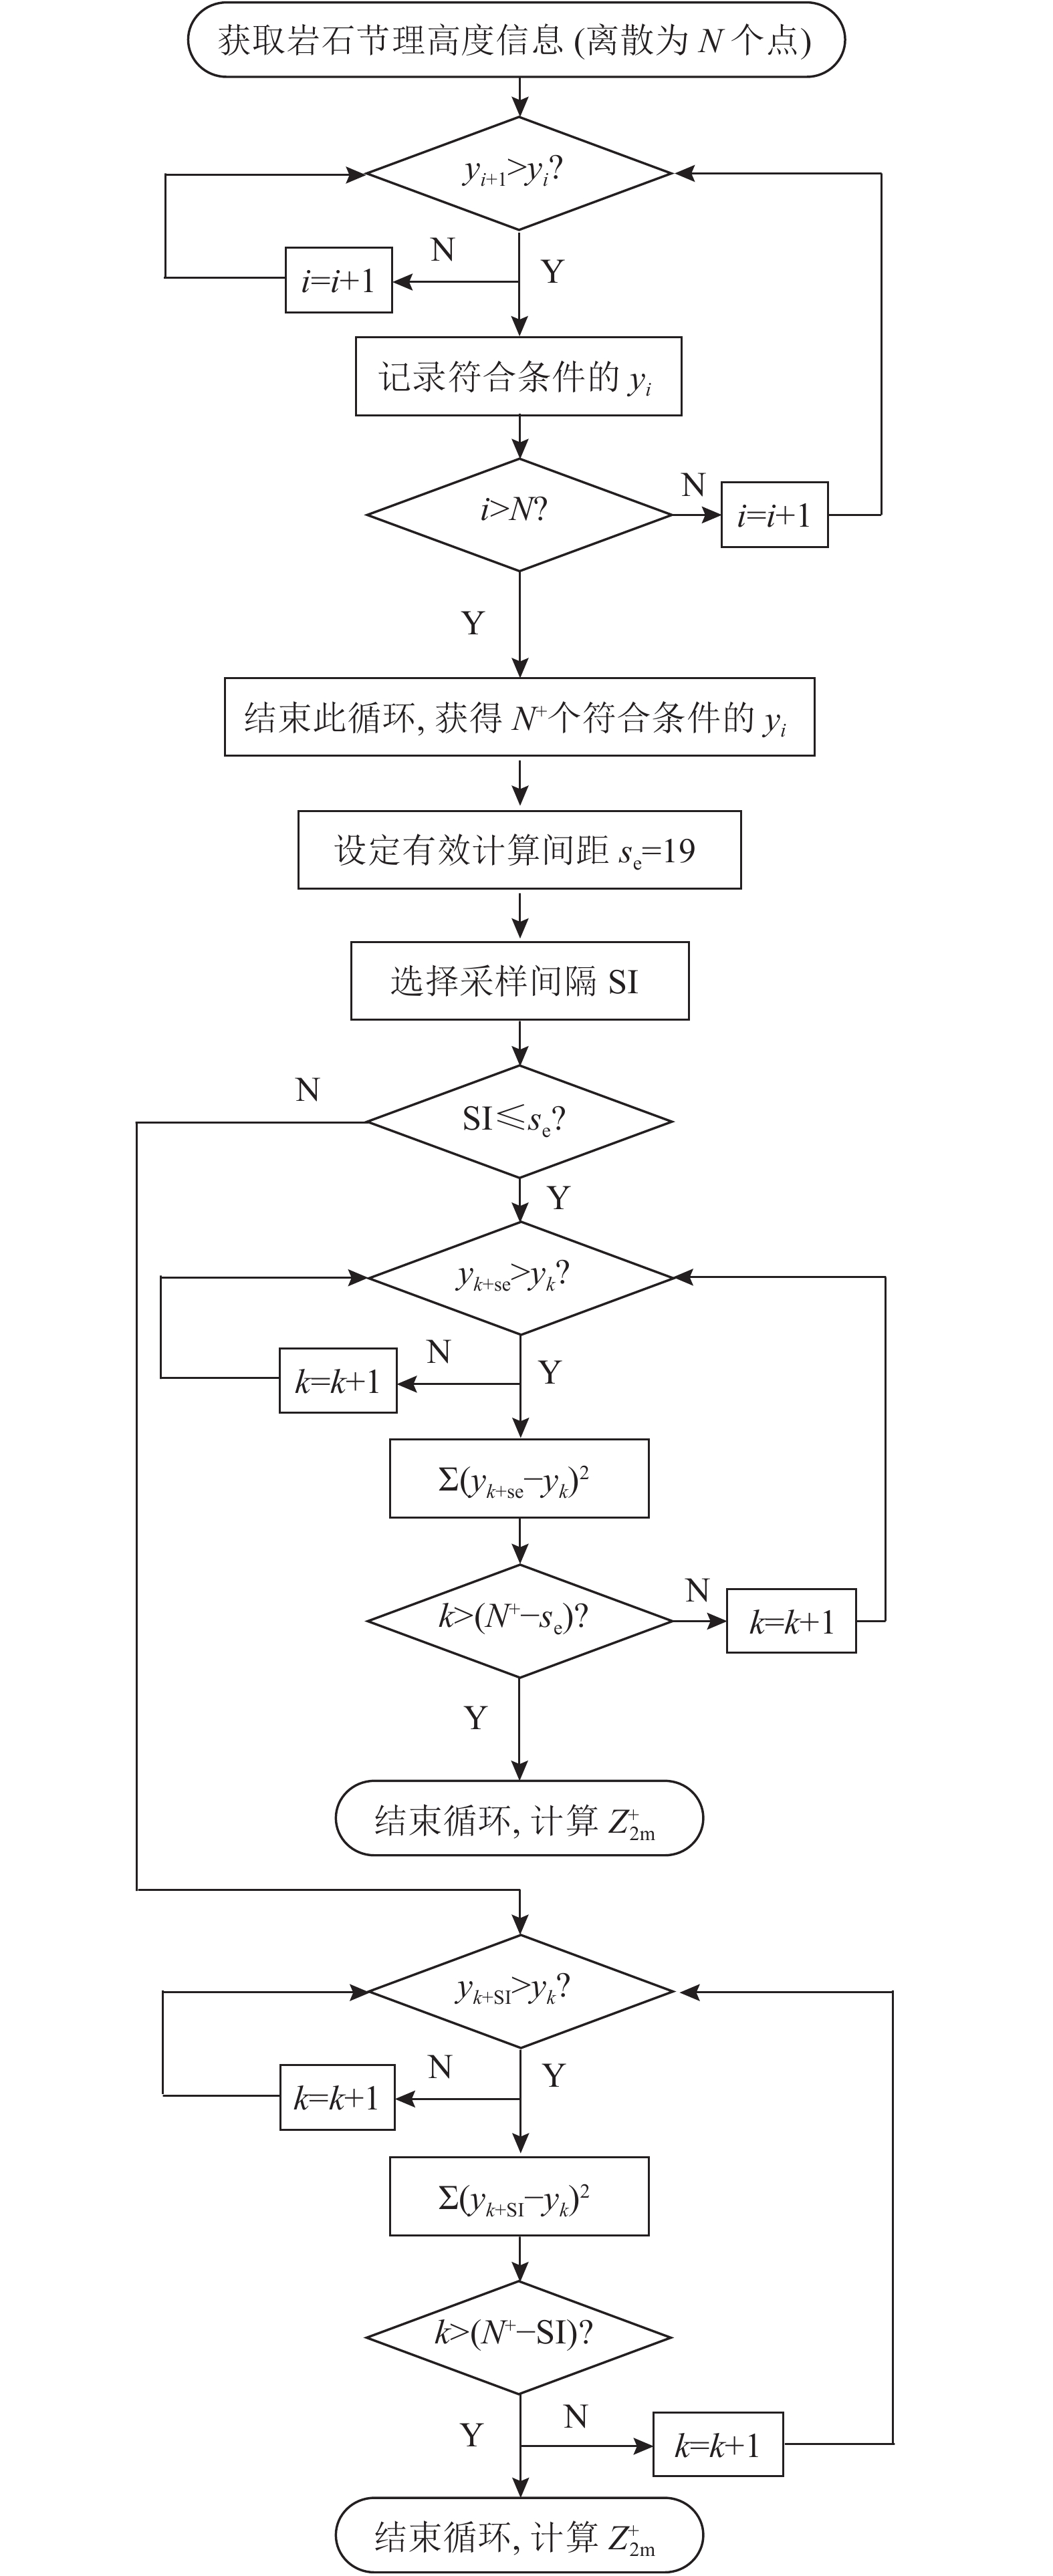
方法鉴于此,深入分析一阶导数均方根表征节理粗糙度的缺陷,提出节理轮廓线上参与计算相邻点有效间距,改进采样间隔趋于最小采样精度时考虑坡向一阶导数均方根算法,建立考虑采样间隔改进参数评估节理粗糙度的统一模型;最后通过试验验证所提模型的可靠性。
结果与结论结果表明:(1) 在采样间隔趋于最小采样精度时,改进一阶导数均方根表征节理粗糙度更有效。(2) 采样间隔在[2.13 mm, 10.1 mm]范围内,不同间隔下38组类岩石节理面4个方向上的粗糙度评估值与实际值平均偏差不超3.0;其中180°方向的标准差低至1.249。(3) 构建的节理粗糙度评价新模型初步解决了一阶导数均方根参数表征节理粗糙度受采样间隔严重影响而不便应用的缺陷,为精准量化岩体节理粗糙度提供了一条新途径,该研究方案也为其他统计参数在节理粗糙度精准评估中的普适应用提供参考借鉴。
Abstract:ObjectiveThe joint roughness of rock masses significantly affects their mechanical properties such as shear strength and permeability. Therefore, its quantitative characterization is significant for the engineering practices of jointed rock masses. Current research achievements indicate that among statistical parameters, the root mean square (RMS) of first derivatives (Z2) exhibits the strongest correlation with the joint roughness of rock masses, serving as a vital method for characterizing joint roughness. However, the characterization using this parameter is severely affected by the sampling interval (SI).
MethodsBased on a systematic analysis of the drawbacks of Z2 in characterizing the joint roughness, this study proposed the concept of effective spacing between two adjacent calculation points on a joint profile. Accordingly, it improved the RMS algorithm of first derivatives that considers the inclination angle and its direction ($Z_2^+ $) in the case where SI approached the minimum sampling resolution. Then, a unified evaluation model incorporating SI was established. Finally, this study verified the reliability of the model using direct shear tests.
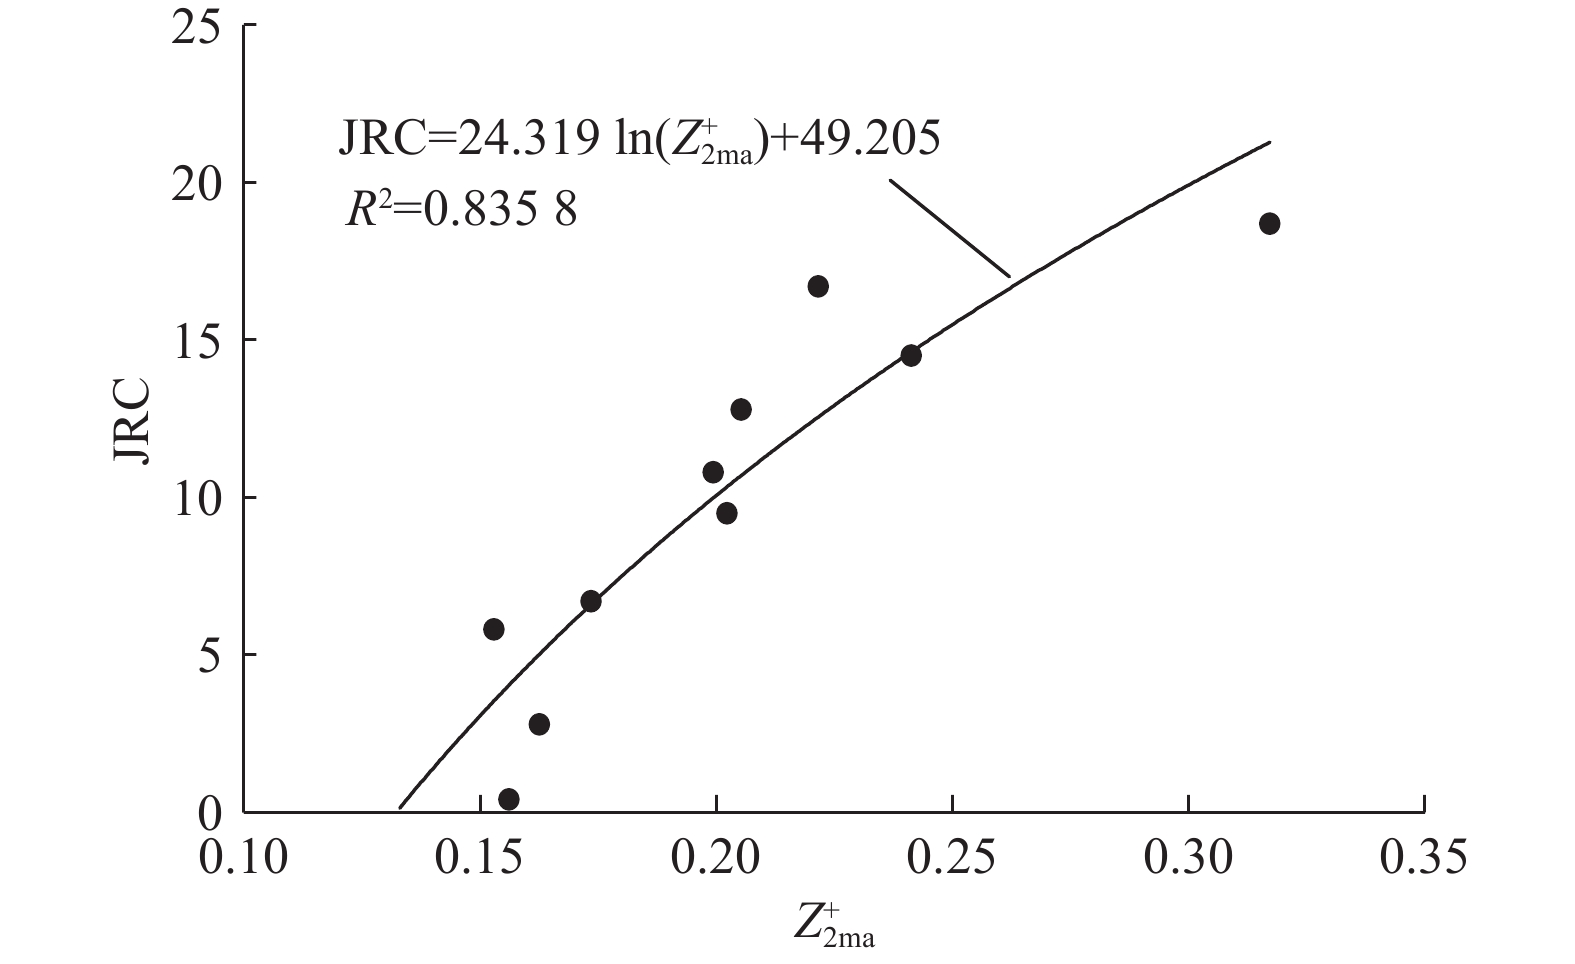
Results and ConclusionsThe results indicate that the improved RMS of first derivatives ($Z_{2ma}^+ $) is more effective in characterizing joint roughness when SI approaches the minimum sampling resolution. Under sampling intervals of [2.13 mm,10.1 mm], 38 groups of artificial joint planes exhibited average deviations between estimated and measured roughness values in four directions of 3.0 or less, with those in the direction of 180° of as low as 1.249. The proposed model addresses the limitation of using the RMS of first derivatives for joint roughness characterization, which is highly sensitive to SI and thus has limited applicability, thus providing a novel approach for the precise quantification of joint roughness. The research scheme of this study can also serves as a referential for the widespread application of other statistical parameters to the accurate assessment of joint roughness.
-
Keywords:
- geological engineering /
- rock joint /
- roughness /
- statistical parameter /
- unified model
-
-
表 1 10条标准节理统计参数$ Z_{2\text{m}}^ + $计算结果
Table 1 Calculation results of statistical parameter $ Z_{2\text{m}}^ + $ of 10 standard joints
SI/mm JRC0-2 JRC2-4 JRC4-6 JRC6-8 JRC8-10 JRC10-12 JRC12-14 JRC14-16 JRC16-18 JRC18-20 0.1 0.154 0.164 0.154 0.173 0.202 0.199 0.206 0.240 0.221 0.319 0.2 0.155 0.162 0.152 0.171 0.199 0.201 0.207 0.242 0.218 0.314 0.4 0.164 0.162 0.151 0.176 0.202 0.202 0.209 0.243 0.223 0.313 0.5 0.151 0.162 0.155 0.174 0.207 0.195 0.200 0.240 0.224 0.323 1.0 0.151 0.158 0.154 0.167 0.208 0.195 0.197 0.234 0.208 0.316 2.0 0.132 0.149 0.150 0.187 0.171 0.199 0.197 0.224 0.201 0.305 2.5 0.139 0.145 0.133 0.138 0.142 0.167 0.143 0.257 0.192 0.314 3.0 0.116 0.126 0.096 0.125 0.146 0.164 0.172 0.210 0.150 0.272 4.0 0.066 0.065 0.105 0.088 0.079 0.136 0.130 0.159 0.141 0.220 5.0 0.069 0.073 0.096 0.097 0.084 0.140 0.141 0.184 0.125 0.252 6.0 0.058 0.053 0.074 0.095 0.082 0.157 0.111 0.139 0.135 0.224 7.0 0.050 0.050 0.086 0.047 0.076 0.134 0.117 0.137 0.107 0.173 8.0 0.043 0.052 0.053 0.078 0.053 0.104 0.089 0.154 0.125 0.188 9.0 0.057 0.051 0.048 0.057 0.047 0.097 0.104 0.145 0.098 0.243 10.0 0.051 0.035 0.037 0.048 0.053 0.121 0.087 0.129 0.102 0.145 表 2 10条标准节理统计参数$ Z_2^ + $计算结果
Table 2 Calculation results of statistical parameter $ Z_{2}^{+} $ of 10 standard joints
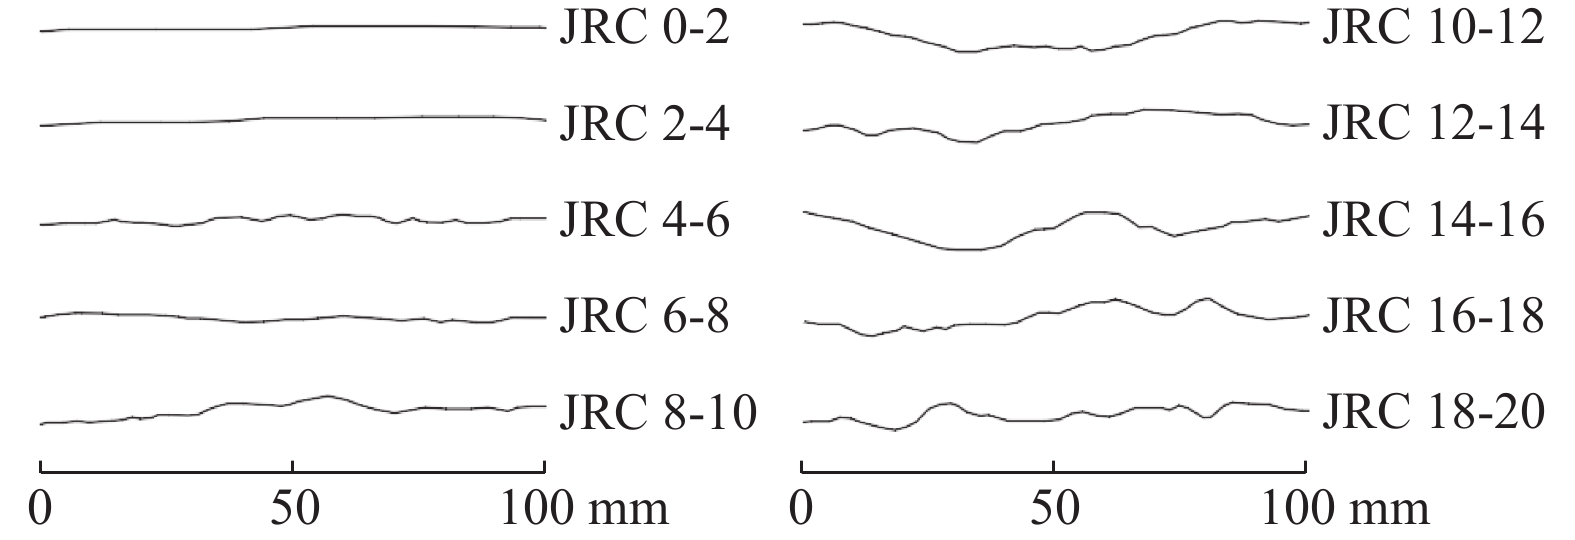
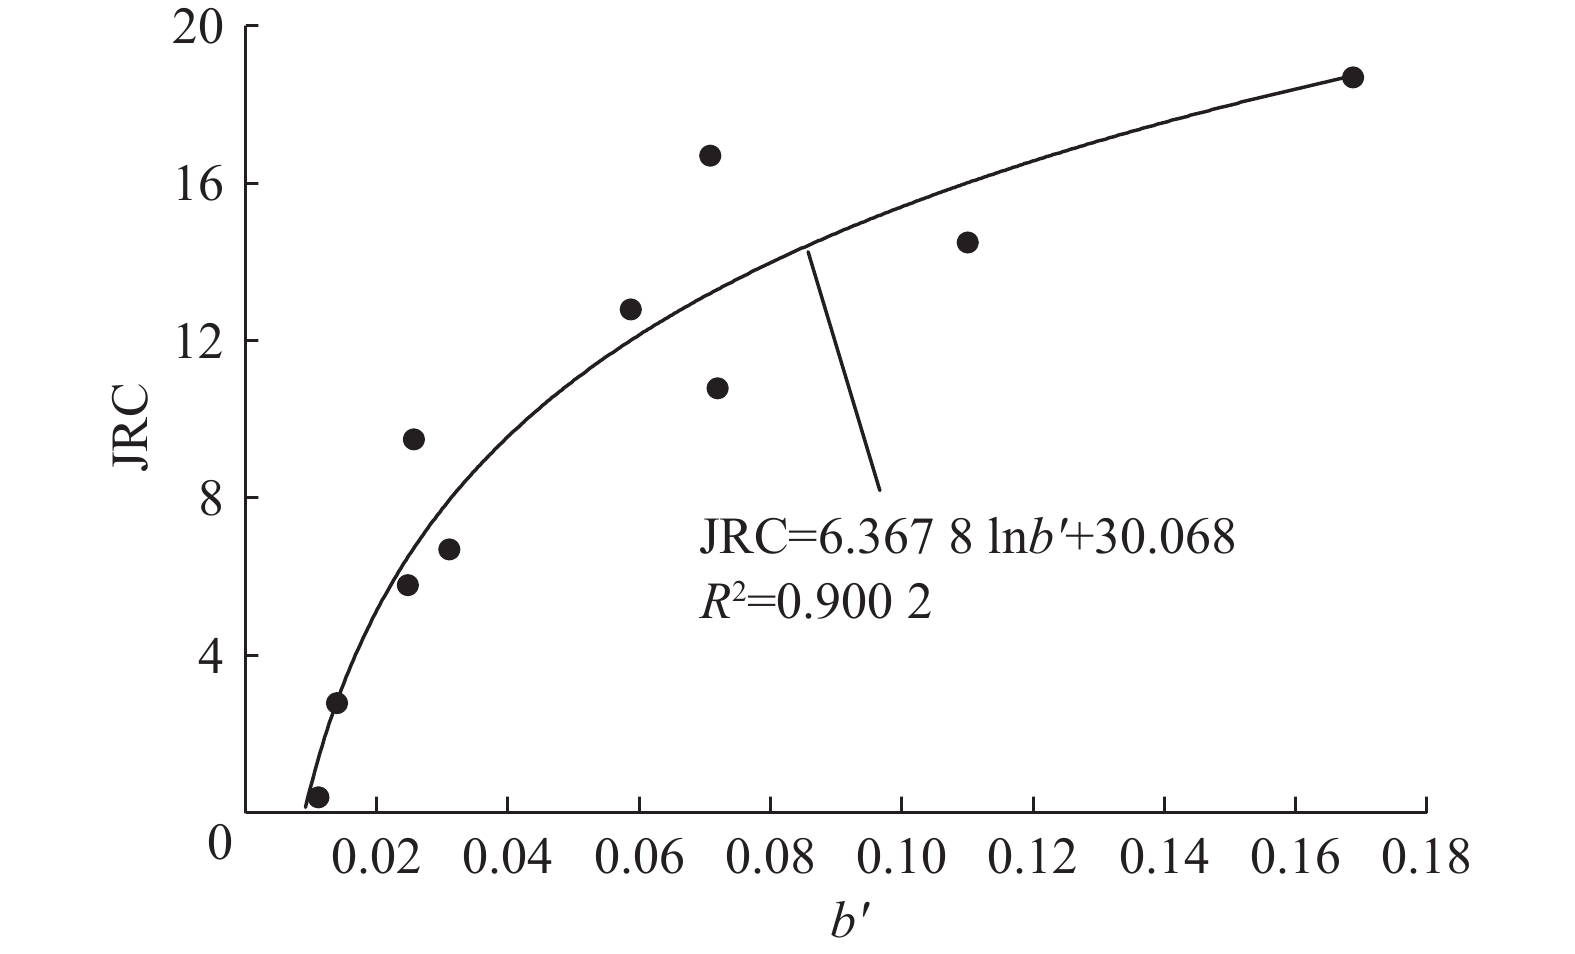
SI/mm JRC0-2 JRC2-4 JRC4-6 JRC6-8 JRC8-10 JRC10-12 JRC12-14 JRC14-16 JRC16-18 JRC18-20 0.1 2.000 1.979 1.938 1.922 1.946 1.915 1.791 1.836 1.893 2.045 0.2 1.000 1.000 0.951 0.963 0.977 0.932 0.906 0.941 0.968 0.977 0.4 0.661 0.549 0.550 0.518 0.536 0.539 0.498 0.511 0.538 0.619 JRC序号 JRC0-2 JRC2-4 JRC4-6 JRC6-8 JRC8-10 JRC10-12 JRC12-14 JRC14-16 JRC16-18 JRC18-20 实际值 0.4 2.8 5.8 6.7 9.5 10.8 12.8 14.5 16.7 18.7 表 4 10条标准节理L/SI与$ Z_{2\text{m}}^ + $关系表达式
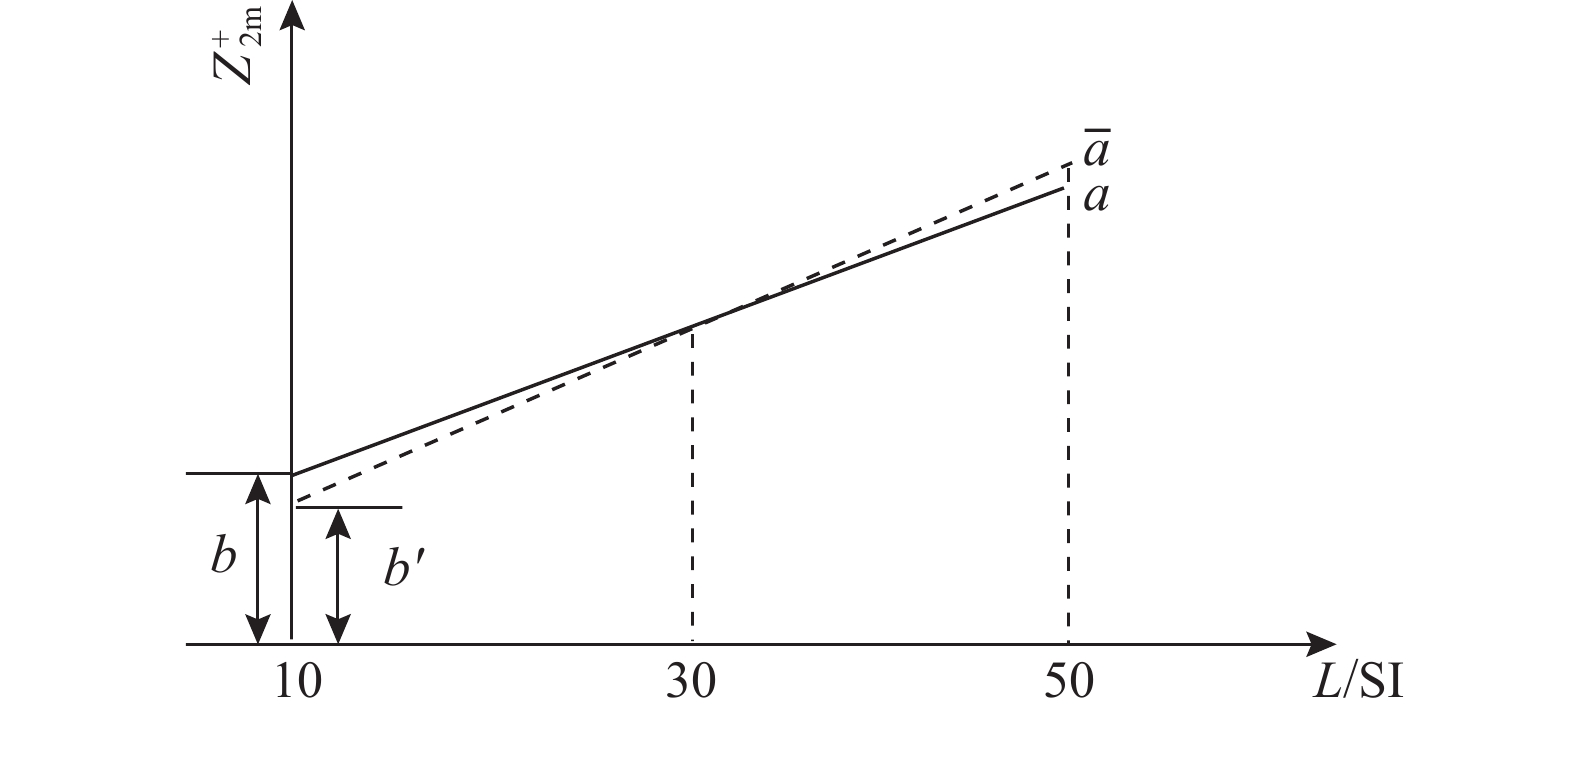
Table 4 Summary of relational expression between the L/SI ratio and $ Z_{2\text{m}}^ + $ for 10 standard joints
标准节理序号 关系式 SI∈[2.0 mm, 10.0 mm] JRC0-2 $ Z_{2 \text{m}}^{+}=0.002\;4(L / \text{SI})+0.021\;9 $,R2= 0.8804 JRC2-4 $ Z_{2 \text{m}}^{+}=0.003\;1(L / \text{SI})+0.003\;7 $,R2= 0.9297 JRC4-6 $ Z_{2 \text{m}}^{+}=0.002\;6(L / \text{SI})+0.029\;5 $,R2= 0.9010 JRC6-8 $ Z_{2 \text{m}}^{+}=0.003\;2(L / \text{SI})+0.017\;8 $,R2= 0.9585 JRC8-10 $ Z_{2 \text{m}}^{+}=0.003\;0(L / \text{SI})+0.014\;8 $,R2= 0.9716 JRC10-12 $ Z_{2 \text{m}}^{+}=0.001\;9(L / \text{SI})+0.097\;7 $,R2= 0.9454 JRC12-14 $ Z_{2 \mathrm{~m}}^{+}=0.002\;2(L / \text{SI})+0.075\;5 $,R2= 0.8115 JRC14-16 $ Z_{2 \text{m}}^{+}=0.002\;7(L / \text{SI})+0.111\;8 $,R2= 0.7338 JRC16-18 $ Z_{2 \text{m}}^{+}=0.002\;6(L / \text{SI})+0.075\;6 $,R2= 0.9761 JRC18-20 $ Z_{2 \text{m}}^{+}=0.003\;9(L / \text{SI})+0.134\;5 $,R2= 0.8086 表 5 参数$a $,$b $调整后L/SI与$ Z_{2 \text{m}}^{+} $关系表达式
Table 5 Relational expressions between the L/SI ratio and $ Z_{2 \text{m}}^{+} $ for 10 standard joints after adjustment of parameters $a $ and $b $
标准节理序号 关系式 SI∈(2.0 mm, 10.0 mm] JRC0-2 $ Z_{2 \text{m}}^{+}=0.002\;76(L /\text{SI})+0.011\;1 $ JRC2-4 $ Z_{2 \text{m}}^{+}=0.002\;76(L /\text{SI})+0.013\;9 $ JRC4-6 $ Z_{2 \text{m}}^{+}=0.002\;76(L /\text{SI})+0.024\;7 $ JRC6-8 $ Z_{2 \text{m}}^{+}=0.002\;76(L /\text{SI})+0.031\;0 $ JRC8-10 $ Z_{2 \text{m}}^{+}=0.002\;76(L /\text{SI})+0.025\;6 $ JRC10-12 $ Z_{2 \text{m}}^{+}=0.002\;76(L /\text{SI})+0.071\;9 $ JRC12-14 $ Z_{2 \text{m}}^{+}=0.002\;76(L /\text{SI})+0.058\;7 $ JRC14-16 $ Z_{2 \text{m}}^{+}=0.002\;76(L /\text{SI})+0.011\;0 $ JRC16-18 $ Z_{2 \text{m}}^{+}=0.002\;76(L /\text{SI})+0.070\;8 $ JRC18-20 $ Z_{2 \text{m}}^{+}=0.002\;76(L /\text{SI})+0.168\;7 $ 表 6 不同法向力下 4 个方向的直剪试验数据
Table 6 Data from direct shear tests in four directions under varying normal forces
剪切
方向/(°)坡度/
(°)节理面
面积/mm2法向力/
N剪切力/
N法向应力/
MPa剪切应力/
MPa0 8 10 098.28 3 000 3 500 0.246 0 0.384 6 4 000 4 600 0.328 9 0.506 2 5 000 5 400 0.415 9 0.598 4 6 000 6 200 0.502 9 0.690 7 90 9 10 124.65 3 000 5 400 0.376 1 0.480 4 4 000 6 400 0.489 1 0.562 5 5 000 7 400 0.602 1 0.644 6 6 000 8 800 0.721 3 0.765 8 180 8 10 098.28 3 000 4 800 0.360 3 0.429 4 4 000 5 800 0.472 2 0.513 6 5 000 7 000 0.586 8 0.617 5 6 000 7 700 0.694 5 0.672 4 270 9 10 124.65 3 000 3 500 0.238 6 0.387 8 4 000 4 700 0.317 6 0.520 3 5 000 5 500 0.402 8 0.613 8 6 000 6 300 0.488 0 0.707 3 表 7 节理面 4 个方向的$ Z_{2{\mathrm{s}}}^{+} $及相应JRC 计算结果
Table 7 Calculation results of $ Z_{2{\mathrm{s}}}^{+} $ and corresponding JRC in four directions for joint planes
SI/mm $ Z_{2{\mathrm{s}}}^{+} $ JRC 0° 90° 180° 270° 0° 90° 180° 270° 0.21 0.266 0.309 0.206 0.171 17.0 20.7 10.7 6.2 0.43 0.250 0.308 0.225 0.172 15.5 20.5 12.9 6.5 0.64 0.178 0.253 0.228 0.162 7.2 15.8 13.2 4.9 0.85 0.224 0.301 0.247 0.171 12.8 20.0 15.2 6.3 1.07 0.218 0.297 0.256 0.165 12.1 19.7 16.1 5.4 1.28 0.151 0.243 0.225 0.139 3.2 14.8 12.9 1.2 1.49 0.171 0.280 0.255 0.154 6.3 18.2 16.0 3.7 1.70 0.153 0.257 0.237 0.136 3.5 16.1 14.2 0.7 1.92 0.182 0.226 0.214 0.171 7.8 13.1 11.7 6.21 2.13 0.180 0.293 0.274 0.150 11.0 18.5 17.7 5.4 2.34 0.175 0.279 0.268 0.141 11.8 18.4 18.0 6.1 2.56 0.137 0.257 0.240 0.128 7.4 18.0 17.2 5.0 2.77 0.148 0.248 0.239 0.125 10.8 17.9 17.5 6.7 2.98 0.131 0.236 0.227 0.113 9.4 17.7 17.3 5.4 3.20 0.192 0.363 0.348 0.171 15.7 21.9 21.5 14.3 3.41 0.216 0.368 0.337 0.160 17.3 22.1 21.4 13.9 3.62 0.203 0.338 0.329 0.158 16.9 21.5 21.3 14.1 3.83 0.156 0.330 0.310 0.149 14.3 21.4 20.9 13.8 4.05 0.183 0.330 0.316 0.155 16.3 21.5 21.2 14.5 4.26 0.201 0.371 0.381 0.166 17.4 22.5 22.7 15.5 4.47 0.136 0.303 0.291 0.122 13.5 21.0 20.7 12.2 4.69 0.147 0.371 0.298 0.128 14.6 22.7 21.0 13.1 4.90 0.137 0.275 0.291 0.117 14.0 20.4 20.8 12.2 5.11 0.132 0.282 0.273 0.116 13.9 20.7 20.4 12.3 5.33 0.139 0.266 0.265 0.114 14.6 20.2 20.2 12.4 5.54 0.134 0.270 0.261 0.117 14.3 20.4 20.2 12.8 5.75 0.112 0.254 0.249 0.103 12.6 20.0 19.9 11.5 5.96 0.118 0.253 0.259 0.105 13.3 20.0 20.2 12.0 6.18 0.115 0.240 0.235 0.101 13.1 19.7 19.5 11.8 6.39 0.096 0.238 0.240 0.089 11.4 19.6 19.7 10.5 6.60 0.132 0.231 0.248 0.106 14.7 19.4 20.0 12.5 6.82 0.093 0.220 0.229 0.086 11.3 19.1 19.4 10.4 7.03 0.085 0.223 0.221 0.083 10.5 19.3 19.2 10.2 7.24 0.111 0.240 0.219 0.084 13.4 19.9 19.2 10.4 7.46 0.105 0.208 0.229 0.079 12.9 18.8 19.6 9.9 7.67 0.090 0.199 0.205 0.066 11.5 18.5 18.7 7.8 7.88 0.103 0.205 0.234 0.089 13.0 18.8 19.8 11.5 8.09 0.075 0.197 0.199 0.080 9.7 18.5 18.6 10.5 8.31 0.078 0.194 0.208 0.077 10.2 18.4 19.0 10.2 8.52 0.086 0.198 0.205 0.076 11.5 18.6 18.9 10.0 8.73 0.073 0.183 0.206 0.067 9.8 18.1 18.9 8.7 8.95 0.076 0.185 0.205 0.066 10.3 18.1 18.9 8.7 9.16 0.099 0.208 0.214 0.070 13.0 19.1 19.3 9.6 9.37 0.089 0.184 0.210 0.081 12.1 18.2 19.2 11.2 9.59 0.078 0.176 0.206 0.060 10.8 17.9 19.0 7.9 9.80 0.087 0.187 0.203 0.065 12.0 18.3 19.0 9.0 10.01 0.057 0.189 0.200 0.056 7.6 18.4 18.9 7.4 表 8 粗糙度估计值与试验值偏离程度计算
Table 8 Degree of deviation between estimated and experimental roughness
样本分类 标准差 0° 90° 180° 270° 全体样本 3.319 1.895 2.943 3.616 小采样间隔样本 5.476 3.281 6.529 6.311 大采样间隔样本 2.685 1.462 1.249 2.765 -
[1] BARTON N,WANG Changshuo,YONG Rui. Advances in joint roughness coefficient (JRC) and its engineering applications[J]. Journal of Rock Mechanics and Geotechnical Engineering,2023,15(12):3352−3379. DOI: 10.1016/j.jrmge.2023.02.002
[2] 胥勋辉,张国彪,包含,等. 基于3D打印技术的岩体结构面各向异性剪切力学行为[J]. 煤田地质与勘探,2020,48(1):154−159. DOI: 10.3969/j.issn.1001-1986.2020.01.020 XU Xunhui,ZHANG Guobiao,BAO Han,et al. Anisotropic shear behavior of rock joint based on 3D printing technology[J]. Coal Geology & Exploration,2020,48(1):154−159. DOI: 10.3969/j.issn.1001-1986.2020.01.020
[3] 祝艳波,杨凡凡,苗帅升,等. 黏结强度对异质土界面强度与变形特性影响试验研究[J]. 煤田地质与勘探,2022,50(10):96−107. DOI: 10.12363/issn.1001-1986.22.02.0103 ZHU Yanbo,YANG Fanfan,MIAO Shuaisheng,et al. Effect of initial adhesion on shear strength and deformation characteristics of interfaces in heterogeneous soils[J]. Coal Geology & Exploration,2022,50(10):96−107. DOI: 10.12363/issn.1001-1986.22.02.0103
[4] 虎维岳,赵春虎,吕汉江. 煤层底板水害区域注浆治理影响因素分析与高效布孔方式[J]. 煤田地质与勘探,2022,50(11):134−143. DOI: 10.12363/issn.1001-1986.22.04.0279 HU Weiyue,ZHAO Chunhu,LYU Hanjiang. Main influencing factors for regional pre–grouting technology of water hazard treatment in coal seam floor and efficient hole arrangement[J]. Coal Geology & Exploration,2022,50(11):134−143. DOI: 10.12363/issn.1001-1986.22.04.0279
[5] TSE R,CRUDEN D M. Estimating joint roughness coefficients[J]. International Journal of Rock Mechanics and Mining Sciences & Geomechanics Abstracts,1979,16(5):303−307.
[6] MYERS N O. Characterization of surface roughness[J]. Wear,1962,5(3):182−189. DOI: 10.1016/0043-1648(62)90002-9
[7] 班力壬,戚承志,单仁亮,等. 一种新的表征岩石节理粗糙度指标系统[J]. 煤炭学报,2018,43(12):3356−3363. BAN Liren,QI Chengzhi,SHAN Renliang,et al. A new 3D roughness parameter system for rock joint[J]. Journal of China Coal Society,2018,43(12):3356−3363.
[8] BELEM T,HOMAND–ETIENNE F,SOULEY M. Quantitative parameters for rock joint surface roughness[J]. Rock Mechanics and Rock Engineering,2000,33(4):217−242.
[9] YU Xianbin,VAYSSADE B. Joint profiles and their roughness parameters[J]. International Journal of Rock Mechanics and Mining Sciences & Geomechanics Abstracts,1991,28(4):333−336.
[10] TATONE B S A,GRASSELLI G. A method to evaluate the three–dimensional roughness of fracture surfaces in brittle geomaterials[J]. Review of Scientific Instruments,2009,80(12):125110.
[11] 唐志成,宋英龙. 一种描述结构面剖面线粗糙度的新方法[J]. 工程地质学报,2011,19(2):250−253. DOI: 10.3969/j.issn.1004-9665.2011.02.017 TANG Zhicheng,SONG Yinglong. New method for assessing rock discontinuity roughness on linear profiles[J]. Journal of Engineering Geology,2011,19(2):250−253. DOI: 10.3969/j.issn.1004-9665.2011.02.017
[12] ZHAO Lianheng,ZHANG Shuaihao,HUANG Dongliang,et al. Quantitative characterization of joint roughness based on semivariogram parameters[J]. International Journal of Rock Mechanics and Mining Sciences,2018,109:1−8. DOI: 10.1016/j.ijrmms.2018.06.008
[13] GRASSELLI G,WIRTH J,EGGER P. Quantitative three–dimensional description of a rough surface and parameter evolution with shearing[J]. International Journal of Rock Mechanics and Mining Sciences,2002,39(6):789−800. DOI: 10.1016/S1365-1609(02)00070-9
[14] 陈曦,曾亚武. 基于Grasselli模型的一个新的岩石节理三维粗糙度指标[J]. 岩土力学,2021,42(3):700−712. CHEN Xi,ZENG Yawu. A new three–dimensional roughness metric based on Grasselli’s model[J]. Rock and Soil Mechanics,2021,42(3):700−712.
[15] 班力壬,候宇航,杜伟升,等. 考虑实际接触节理微凸体对剪切强度不同贡献比例的峰值剪胀角模型[J]. 煤炭学报,2023,48(10):3688−3699. BAN Liren,HOU Yuhang,DU Weisheng,et al. A new peak dilation angle model for rock joints considering different contribution proportions of actual contact joint asperities to shear strength[J]. Journal of China Coal Society,2023,48(10):3688−3699.
[16] EL–SOUDANI S M. Profilometric analysis of fractures[J]. Metallography,1978,11(3):247−336. DOI: 10.1016/0026-0800(78)90045-9
[17] 葛云峰,唐辉明,黄磊,等. 岩体结构面三维粗糙度系数表征新方法[J]. 岩石力学与工程学报,2012,31(12):2508−2517. DOI: 10.3969/j.issn.1000-6915.2012.12.015 GE Yunfeng,TANG Huiming,HUANG Lei,et al. A new representation method for three–dimensional joint roughness coefficient of rock mass discontinuities[J]. Chinese Journal of Rock Mechanics and Engineering,2012,31(12):2508−2517. DOI: 10.3969/j.issn.1000-6915.2012.12.015
[18] 蔡毅,唐辉明,葛云峰,等. 岩体结构面三维粗糙度评价的新方法[J]. 岩石力学与工程学报,2017,36(5):1101−1110. CAI Yi,TANG Huiming,GE Yunfeng,et al. A new method for evaluating the roughness of three–dimensional discontinuity surface of rock[J]. Chinese Journal of Rock Mechanics and Engineering,2017,36(5):1101−1110.
[19] CHEN Shijiang,ZHU Wancheng,YU Qinglei,et al. Characterization of anisotropy of joint surface roughness and aperture by variogram approach based on digital image processing technique[J]. Rock Mechanics and Rock Engineering,2016,49(3):855−876. DOI: 10.1007/s00603-015-0795-x
[20] DEVELI K. Computation of direction dependent joint surface parameters through the algorithm of triangular prism surface area method:A theoretical and experimental study[J]. International Journal of Solids and Structures,2020,202:895−911. DOI: 10.1016/j.ijsolstr.2020.06.038
[21] WANG Changshuo,WANG Liangqing,KARAKUS M. A new spectral analysis method for determining the joint roughness coefficient of rock joints[J]. International Journal of Rock Mechanics and Mining Sciences,2019,113:72−82. DOI: 10.1016/j.ijrmms.2018.11.009
[22] 洪陈杰,翁寒倩,王凯,等. 岩石结构面Grasselli二维粗糙度指标优化及其JRC估算[J]. 岩土工程学报,2024,46(6):1146−1154. HONG Chenjie,WENG Hanqian,WANG Kai,et al. Updating Grasselli’s 2D morphology parameter for estimating JRC of rock joints[J]. Chinese Journal of Geotechnical Engineering,2024,46(6):1146−1154.
[23] 黄曼,洪陈杰,杜时贵,等. 岩石结构面形貌分级方法及两级粗糙特性研究[J]. 岩石力学与工程学报,2020,39(6):1153−1164. HUANG Man,HONG Chenjie,DU Shigui,et al. Study on morphological classification method and two–order roughness of rock joints[J]. Chinese Journal of Rock Mechanics and Engineering,2020,39(6):1153−1164.
[24] 陈冲,陈胜宏. 结构面轮廓不等间距采样、向量表征与粗糙度[J]. 岩石力学与工程学报,2021,40(增刊1):2798−2805. CHEN Chong,CHEN Shenghong. Unequal interval sampling,vector representation and roughness of joint profile[J]. Chinese Journal of Rock Mechanics and Engineering,2021,40(Sup.1):2798−2805.
[25] 陈曦,曾亚武. 粗糙节理的改进形貌表征方法及采样点距效应[J]. 浙江大学学报(工学版),2021,55(11):2161−2169. CHEN Xi,ZENG Yawu. Improved morphology characterization method and sampling effect of rough rock joint[J]. Journal of Zhejiang University(Engineering Science),2021,55(11):2161−2169.
[26] ABOLFAZLI M,FAHIMIFAR A. An investigation on the correlation between the joint roughness coefficient (JRC) and joint roughness parameters[J]. Construction and Building Materials,2020,259:120415. DOI: 10.1016/j.conbuildmat.2020.120415
[27] JANG H S,KANG S S,JANG B A. Determination of joint roughness coefficients using roughness parameters[J]. Rock Mechanics and Rock Engineering,2014,47(6):2061−2073. DOI: 10.1007/s00603-013-0535-z
[28] 吴月秀,刘泉声,刘小燕. 岩体节理粗糙度系数与统计参数的相关关系研究[J]. 岩石力学与工程学报,2011,30(增刊1):2593−2598. WU Yuexiu,LIU Quansheng,LIU Xiaoyan. Study of relationship between joint roughness coefficient and statistical parameters[J]. Chinese Journal of Rock Mechanics and Engineering,2011,30(Sup.1):2593−2598.
[29] LI Yanrong,ZHANG Yongbo. Quantitative estimation of joint roughness coefficient using statistical parameters[J]. International Journal of Rock Mechanics and Mining Sciences,2015,77:27−35. DOI: 10.1016/j.ijrmms.2015.03.016
[30] YANG Z Y,LO S C,DI C C. Reassessing the joint roughness coefficient (JRC) estimation using Z2[J]. Rock Mechanics and Rock Engineering,2001,34(3):243−251. DOI: 10.1007/s006030170012
[31] TATONE B S A,GRASSELLI G. A new 2D discontinuity roughness parameter and its correlation with JRC[J]. International Journal of Rock Mechanics and Mining Sciences,2010,47(8):1391−1400. DOI: 10.1016/j.ijrmms.2010.06.006
[32] 张建明,唐志成,蒋景东,等. 统计参数与JRC的定量关系研究[J]. 科学技术与工程,2015,15(14):1−5. DOI: 10.3969/j.issn.1671-1815.2015.14.001 ZHANG Jianming,TANG Zhicheng,JIANG Jingdong,et al. A study of relationships between statistical parameters of typical rock–joint curves and JRC based on image analysis techniques[J]. Science Technology and Engineering,2015,15(14):1−5. DOI: 10.3969/j.issn.1671-1815.2015.14.001
[33] 葛云峰,唐辉明,王亮清,等. 天然岩体结构面粗糙度各向异性、尺寸效应、间距效应研究[J]. 岩土工程学报,2016,38(1):170−179. GE Yunfeng,TANG Huiming,WANG Liangqing,et al. Anisotropy,scale and interval effects of natural rock discontinuity surface roughness[J]. Chinese Journal of Geotechnical Engineering,2016,38(1):170−179.
[34] 宋磊博,江权,李元辉,等. 不同采样间隔下结构面形貌特征和各向异性特征的统计参数稳定性研究[J]. 岩土力学,2017,38(4):1121−1132. SONG Leibo,JIANG Quan,LI Yuanhui,et al. Stability of statistical parameters of discontinuities morphology and anisotropy based on different sampling intervals[J]. Rock and Soil Mechanics,2017,38(4):1121−1132.
[35] 张国彪,包含,兰恒星,等. 结构面粗糙度系数与采样精度的关系研究[J]. 工程地质学报,2018,26(5):1336−1341. ZHANG Guobiao,BAO Han,LAN Hengxing,et al. Research on the relationship between joint roughness coefficient and sampling precision of structural plane[J]. Journal of Engineering Geology,2018,26(5):1336−1341.
[36] 王昌硕,王亮清,葛云峰,等. 基于统计参数的二维节理粗糙度系数非线性确定方法[J]. 岩土力学,2017,38(2):565−573. WANG Changshuo,WANG Liangqing,GE Yunfeng,et al. A nonlinear method for determining two–dimensional joint roughness coefficient based on statistical parameters[J]. Rock and Soil Mechanics,2017,38(2):565−573.
[37] ZHANG Guangcheng,KARAKUS M,TANG Huiming,et al. A new method estimating the 2D joint roughness coefficient for discontinuity surfaces in rock masses[J]. International Journal of Rock Mechanics and Mining Sciences,2014,72:191−198. DOI: 10.1016/j.ijrmms.2014.09.009
[38] BARTON N,CHOUBEY V. The shear strength of rock joints in theory and practice[J]. Rock Mechanics,1977,10(1):1−54.
[39] 陈世江,常建平,姬长兴,等. 两统计参数评估结构面粗糙度探讨及试验验证[J]. 岩石力学与工程学报,2021,40(3):476−489. CHEN Shijiang,CHANG Jianping,JI Changxing,et al. A two–parameter evaluation method of joint roughness and its experimental verification[J]. Chinese Journal of Rock Mechanics and Engineering,2021,40(3):476−489.


 下载:
下载:

